Generative artificial intelligence (GenAI) is increasingly being used in language assessment, formative feedback, tutoring, translation, and writing support, most assessments focus on accuracy, on user perception, or on short-term performance. This study creates a cross-national benchmark for assessing responsible AI in four areas: validity, equity, privacy and pedagogical value. The analysis was based on a secondary data set made publicly available and comprising 960 analysis-ready learner-profile records from eight national contexts and four CEFR levels, 2,880 learner-model evaluation records, 960 learning-outcome records, 270 privacy-audit observations, and 36 policy-transparency ratings. The archived dataset is a processed secondary data source for which the repository documentation states that SMOTE balancing was carried out in the pre-processing step; instances resampled in the SMOTE step are not viewed as additional, independently recruited learners but as analytical instances. Repeated-measures and mixed ANOVA, HC3 adjusted ANCOVA, intraclass correlations, and nonparametric policy comparisons were used to compare three anonymized AI conditions. Model effects were large for validity, F(2, 1918) = 1522.14, p < .001, partial eta-squared = .614; pedagogical quality, F(2, 1918) = 11523.05, p < .001, partial eta-squared = .923; and privacy, F(2, 178) = 40.98, p < .001, partial eta-squared = .315. Model_A had the best overall validity and learning-transfer profile, Model_B had the best privacy and governance profile, and Model_C did not meet the prespecified 70-point minimum-pillar criterion. The analysis reveals that accuracy is not enough to make an AI for education responsible.
Research ArticleResponsible AI in Language EducationIn progress
A Cross National Benchmark for Responsible AI in Language Education: Validity, Equity, Privacy, and Pedagogical Value
Correspondence: saymasayma1290@gmail.com
Abstract
Keywords responsible AIgenerative AIlanguage educationcross-national benchmarkingvalidityequityprivacypedagogical value
1. Introduction
1.1 Background and Problem Context
Generative artificial intelligence (GenAI) has rapidly taken its place in language learning. Conversational systems are used by learners for grammatical explanations, dialogue practice, translation, writing revision, and instant feedback, and by teachers for task design, adaptation, rubric construction and scaling of formative support. However, the evidence is still scattered throughout tools, skills, courses, and countries, and continues to prioritize perceived usefulness or short-term performance over validity, fairness, privacy and long-term learning outcomes (Koç & Savaş, 2025); (Law, 2024); (Li et al., 2025); (Lo et al., 2024). This evidence gap makes responsible institutional adoption more complicated.
It's a problem particularly significant in formative writing. In order for learners to identify important problems, understand the significance of the problem, decide what to do next, and retain responsibility for generating or evaluating solutions, feedback should be effective(Boud & Molloy, 2013); (Carless & Boud, 2018); (Hattie & Timperley, 2007); (Shute, 2008). While AI feedback might be quick, comprehensive, and scalable, none of these attributes is a mark of learning. While (Escalante et al., 2023) reported efficiency gains without superior language gains to human feedback, (Mahapatra, 2024) reported benefits when ChatGPT was embedded in guided formative feedback. Responsible evaluation must be more than just about being fluent and improving the text in the moment.
1.2 What AI Does in the Present Study
This is not a study to train a new prediction model, but rather to assess AI. Three generative-AI conditions (Model_A, Model_B, and Model_C) are contrasted in the areas of language-issue detection, performance judgments, formative feedback, privacy-sensitive interactions, revision, and learning transfer. Labels are anonymized on purpose in order to avoid ranking version-sensitive commercial systems as permanent rankings, and to ensure provider neutrality. Conclusions are drawn from the conventional statistical procedures that evaluate the archived outputs, and do not apply to named platforms in general.
1.3 Research Gap
Only a few studies combine validity, equity, privacy/governance and learning transfer in one empirical decision framework. Writing gains or perceptions are typically the focus of intervention research, linguistic or demographic disparities are the focus of bias research, disclosure or governance are the focus of privacy studies, and capability is the focus of benchmarks. While L2-Bench further promotes pedagogy-led evaluation in over 1,000 L2 tasks, it lacks the four key features of independent transfer, subgroup equity, interaction-level privacy, and policy transparency found in (Edgell et al., 2026). RAiLE links learner agency, linguistic plurality, system design, and governance, but is conceptual in its main thrust (Khodi & Curle, 2026). There is still a need for an auditable framework which connects these evidence streams together.
1.4 Novelty and Contributions
The study has five contributions. It (1) separates out the domains of validity, equity, privacy, and pedagogical value; (2) views stochastic generation as a reliability issue; (3) assesses contextual robustness by conducting model-by-country and model-by-subgroup analyses; (4) correlates observable privacy behavior with policy transparency; and (5) correlates feedback quality with revision, immediate transfer, and delayed transfer. These domains are connected in a non-compensatory way, meaning that if a child performs poorly in one domain, this does not compensate for strong performance in another, and provide a clear basis for educational and governance decisions.
1.5 Aim and Objectives
This study seeks to create and utilize a cross-national reference point for responsible AI in language learning, based on an openly available secondary dataset.
Objective 1. Compare the performance, pedagogical quality and run-to-run stability of the three AI model conditions with respect to the validity.
Objective 2. Compare across countries, by gender and by socioeconomic status with contextual interactions, by subgroup differences and by bias incidence rates.
Objective 3. Compare interaction-level privacy protections and policy transparency indicators in the three conditions of AI.
Objective 4. Make estimates of difference between revision, immediate transfer and delayed transfer, after taking baseline performance and learner/context factors into account.
Objective 5. Apply a minimum-threshold rule to integrate the four benchmark pillars and evaluate the sensitivity of deployment classification to different thresholds.
1.6 Research Questions
RQ1. What are the differences in validity-related performance, pedagogical quality, and run-to-run reliability between the three conditions of the AI models?
RQ2. How different are the performance of responsible-AI in different countries and among learner subgroups based on gender and socioeconomic status?
RQ3. What are the differences between the three AI conditions in terms of indicators of interaction-level privacy protections and policy transparency?
RQ4. What are the differences between the three AI conditions in terms of revision performance, immediate transfer and delayed transfer after controlling for baseline performance and learner/context characteristics?
RQ5. What are the AI conditions that meet the four-pillar non-compensatory threshold, and what is the strength of the classifications under other decision thresholds?
2. Literature Review and Conceptual Framework
2.1 AI-Supported Feedback and Language Learning
GenAI can enhance access to explanations, examples, translations, formative assessment, and revision support and is especially helpful in contexts where teachers' capacity for feedback is constrained. The same affordance can be pedagogically weak if it replaces a learner's decision-making process, treats an dominant language variant as a neutral version, or enhances the text but fails to enhance the learner's performance, or if it interferes with their performance. Feedback research suggests, then, that feedback can be a source of learning if learners recognize it, consider its relevance, respond to it, and transfer the underlying concepts (Carless & Boud, 2018; Nicol & Macfarlane‐Dick, 2006). As a result, AI feedback should have four criteria to be assessed for correctness, clarity, "actionability," scaffolding, learner agency, and transfer.
2.2 Validity and Reliability
Validity issues address whether evidence justifies the intended score interpretation and use of the scores or judgment. Relevant evidence for AI-supported language education is error detection, alignment to expert-referenced performance, task relevant, cultural defensibility, and consistency across repeated generations. Even though they may be fluent, a correction might not be valid if it alters the meaning, camouflages language variation, produces new errors, or differ significantly from one run to the next. Due to the stochastic nature of generative systems, the design for the measurement process includes the additional constraint of repeated inference and the expression of uncertainty.
2.3 Equity Across Languages, Learners, and Contexts
Performing average is not equitable. Various sources of bias can be present in training data, training labels, evaluation criteria, interfaces, deployment rules and feedback loops (Baker & Hawn, 2022). In language education, dominant varieties can be referred to as nonstandard varieties and may be represented in the wrong ways as neutral standards; (Fleisig et al., 2024)noted sub-optimal modelling of a range of nonstandard English varieties. Therefore cross-national evaluation should include interaction of model-cluster by context, worst-group, and subgroup results but should limit the interpretation of the country-categories to an interpretation of results of the models by the context.
2.4 Privacy and Data Governance
Language-learning interactions might include: drafts, identifiers, academic records, demographic information, sensitive disclosures, and more. Evaluation of privacy at the interaction and governance levels should be considered. The interaction audits verify if the systems are asking for unnecessary PII, are warning of unsafe disclosure, are suggesting redaction, avoiding repeated sensitive information, and suggesting safer alternatives. Governance audits include audits on retention, training utilization, deletion, access by third-parties, control by humans and protection of minors. The concern reflect what is already included in the learning-analytics' principles of transparency, consent, data minimisation, power asymmetry, and user control (Liu & Khalil, 2023; Mutimukwe et al., 2022; Pardo & Siemens, 2014)
2.5 Pedagogical Value and Learning Transfer
Improvement of a submitted text learning. An AI system can enhance an artifact by providing language that the learner is unable to produce on his/her own. The focus of evaluation should thus be on revision gain beyond unaided immediate and delayed transfer and, if feasible, feedback uptake, trust and cognitive load, as well as learner voice. These differences can account for mixed results in the area of AI feedback; the impact can vary by the AI's level of proficiency, task design, teacher mediation, learner training, and what sort of feedback leads learners to reason versus substituting ((Escalante et al., 2023; Mahapatra, 2024; Zhang, 2020; Zhang & Hyland, 2018)
2.6 Comparative Positioning of Prior Studies and the Present Work
As Table 1 shows, existing research provides important but incomplete evidence. The present benchmark is not intended to replace intervention, bias, privacy, or conceptual research. Instead, it brings together core elements of these traditions within one empirical decision architecture: model capability, contextual equity, observable privacy behavior, policy transparency, and independent learning outcomes under a transparent minimum-pillar rule.
Table 1
Comparison of Prior Research and the Present Benchmark
| Study | Design / context | Validity | Equity | Privacy | Learning transfer | Cross-national | Primary contribution or limitation |
|---|---|---|---|---|---|---|---|
| Escalante et al. (2023) | AI versus human writing feedback | Partial | Not assessed | Not assessed | Partial | No | Efficiency and preference evidence; no integrated responsible-AI audit |
| Mahapatra (2024) | Mixed-methods ChatGPT writing intervention | Partial | Not assessed | Not assessed | Yes | No | Positive writing effects in one institutional setting |
| Fleisig et al. (2024) | Dialect and linguistic-bias evaluation | Partial | Explicit | Not assessed | Not assessed | Partial | Demonstrates dialect discrimination; no learning or privacy outcomes |
| Edgell et al. (2026) | L2-Bench pedagogy-led capability benchmark | Explicit | Partial | Not assessed | Not assessed | Partial | Authentic L2 task taxonomy and rubric-based model evaluation |
| Khodi & Curle (2026) | RAiLE sociotechnical framework | Conceptual | Explicit | Explicit | Conceptual | Broad | Integrates pedagogy, agency, plurality, design, and governance; not an empirical model comparison |
| Present study | Secondary cross-national four-pillar benchmark | Explicit | Explicit | Explicit | Explicit | Yes | Combines repeated inference, subgroup gaps, privacy behavior, policy transparency, transfer, and a non-compensatory decision rule |
Note. “Explicit” indicates direct measurement; “Partial” indicates indirect or limited coverage; “Not assessed” indicates that the dimension was not a central outcome. The comparison concerns study scope rather than overall study quality.
2.7 Integrated Four-Pillar Responsible-AI Framework
TAligned with the NIST AI Risk Management (AI Risk) Framework and the Preferred Practices Guide for Managing the Risk of AI (AI Risk Profile) that prioritizes the need for different types of validation and reliability and Fairness, Privacy Enhancement, Transparency, and Accountability (Tabassi,2023),(National Institute of Standards and Technology (US), 2024; Tabassi, 2023)), the benchmark highlights the following requirements as separate but related: Visibility of the pillars is important because educational institutions may be expected to accord different prioritisation to the pillars, according to each use case, in a legitimate manner.
3. Methodology
3.1 Research Design and Data Source
This study employed a secondary quantitative benchmark design with a benchmark retrieved from a publicly archived category "Responsible AI Language Education Benchmark" on the platform Kaggle . The present authors analysed the archive as it was, and did not re-invent features of the original collection that were not documented. (Chawla et al., 2002)reports SMOTE-based balancing during pre-processing in the repository documentation but the public file does not contain all the resampling parameters or pre-SMOTE class distribution. Re-sampled rows are, then, not independent learners or from the population (recruitment samples cannot be re-sampled), and inferences are only to the archived benchmark, not to causal national effects or prevalence in the population. The workbook is connected to learner characteristics, AI-evaluation metrics, learning outcomes, privacy and policy audits, benchmark tasks and variable definitions.
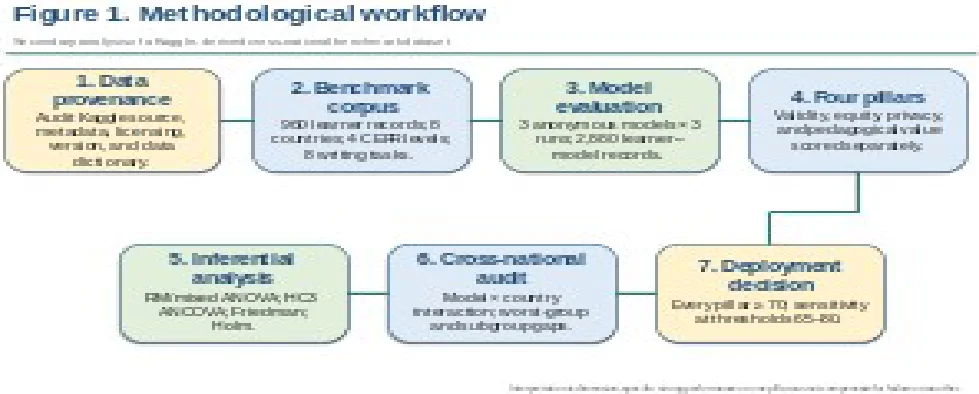
There were three layers of analysis. Initially all three anonymous AI conditions were run with each learner profile to then compare validity-related performance outcomes, pedagogical quality, and repeated-run stability. Second, the out-come file made an association between each profile and 1 of the AI conditions for revision, immediate and delayed transfer. Third, privacy was evaluated with matched non-identifiable scenarios and indicators of the transparency of the condition level policies. Exercise 1 outlines the steps that was taken from archived data and model evaluation to disaggregated analysis and the final threshold based decision.
Figure 1 separates data provenance, model evaluation, pillar-specific analysis, and the final deployment rule. This sequence is important because the decision criterion is applied only after reliability, contextual, privacy, and learning evidence have been examined independently.
3.2 Dataset, Sample, and Benchmark Tasks
The final data set was analysis-ready data consisting of 960 learner-profile records from eight national-context groups (120 records for each country: Bangladesh, Brazil, Germany, India, Japan, Mexico, South Korea, and Türkiye). Mean age was 23.36 years (SD = 3.56). Gender was recorded as woman (n = 456, 47.5%), man (n = 456, 47.5%), and non-binary/other (n = 48, 5.0%). Three balanced tertiles of socioeconomic status (n = 320 for each tertile) were used. There were also 400 urban, 280 peri-urban and 280 rural records collected, as well as 609 public-institution and 351 private-institution records. Mean digital literacy was 3.25 on a 1-5 scale (SD = 0.83). These counts refer to the analytic-ready data and should not be interpreted as national population distributions as the data set is a balanced secondary resource.
The teaching language was English. The Common European Framework of Reference for Languages (Council of Europe, 2020) was followed, with an equal number of CEFR learners at each of the four proficiency levels A2, B1, B2 and C1 (n = 240 for each level). Eight benchmark prompts related to argumentative, compare-contrast, problem-solution, reflective, and position-writing tasks regarding student employment, indoor smoking, learning online vs. in-person, the educational use of GenAI, public transport, social media and learning, studying abroad, and environmental responsibility. There were 320 records associated with each of the AI conditions, for the learning-outcome analysis. All of the 960 learner-profile records were assessed by the three AI conditions in model-performance analysis.
Table 2
Sample Characteristics
| Characteristic | Category | n | % |
|---|---|---|---|
| Country | Bangladesh; Brazil; Germany; India; Japan; Mexico; South Korea; Türkiye | 120 each | 12.5 each |
| CEFR level | A2; B1; B2; C1 | 240 each | 25.0 each |
| Gender | Woman | 456 | 47.5 |
| Man | 456 | 47.5 | |
| Non-binary/Other | 48 | 5.0 | |
| SES tertile | Low; Middle; High | 320 each | 33.3 each |
| Urbanicity | Urban | 400 | 41.7 |
| Peri-urban | 280 | 29.2 | |
| Rural | 280 | 29.2 | |
| Institution | Public | 609 | 63.4 |
| Private | 351 | 36.6 | |
| Assigned model | Model_A; Model_B; Model_C | 320 each | 33.3 each |
Note. 960 learning profile ready-for-analysis learner records. Mean age = 23.36 years (SD = 3.56); mean digital literacy = 3.25 on a 1-5 scale (SD = 0.83). Country and subgroup percentages are for the balanced secondary dataset and not estimates of population.
3.3 Use of AI and Model-Evaluation Protocol
There are three generative-model conditions available in the dataset as Model_A, Model_B and Model_C. Labels ensure provider neutrality and less interpretation of version-specific systems. The three conditions resulted in a total of 2,880 learner-model records, across 960 learner profiles, each recording 3 stochastic generations, or 8,640 aggregated run-level outputs. None of the machine-learning models were trained to estimate the statistical results. The complete interference settings, release dates, and product identifiers cannot be used in the public analysis file, so conclusions can only be drawn for anonymized conditions.
3.4 Measures and Operationalization
3.4.1 Validity
Performance in detecting errors was summarized using the mean F1 score over the three runs. Agreement between the score and the 100-point scale expert-referenced baseline score was represented with the codebook as Score agreement = 100 - (4 x the absolute mean difference between score and expert-referenced 100-point baseline score), with a range of 0 to 100. Variability penalised in F1 and holistic scores as a measure of run consistency. Relevance, cultural sensitivity, hallucination incidence and bias incidence remained as independent items. The validity composite was assembled using pre-specified weights derived from the codebook that was archived; those weights were not estimated between these weights and the present sample.
Validity = .40(F1 × 100) + .20(Score Agreement) + .15(Relevance) + .10(Cultural Sensitivity) + .10(Run Consistency) + .05(Hallucination Control) − 10(Bias Rate)
The bounded mean transformation of the hallucination count was used to deal with the Hallucination control. The pedagogical-quality index gathered relevance, clarity, actionability, scaffolding, learner agency and cultural sensitivity, and a punishment for bias incidents. The confusion that could occur from viewing these as unidimensional psychometric scales (as indicated by alpha values) and thus interpreting them as such was avoided. The baseline comparison used is labelled as expert-referenced, although the public analysis file does not include any rater-level information about the number of raters, training, adjudication rules, etc., or interrater agreement. Therefore, these values have been used as reference scores provided by the expert and are not individually re-validated.
3.4.2 Equity
Equity evidence included country-specific validity means, the maximum country gap, gender and socioeconomic-status gaps, the bias-incident rate, and a model-level composite. The composite was calculated as follows:
Equity = 100 − [4(Country Gap) + 2(Gender Gap) + 2(SES Gap) + 70(Bias Rate)]
The coefficients represent prespecified normative penalties rather than empirically calibrated utilities. The study therefore reports the underlying subgroup gaps alongside the composite and treats the country-by-model interaction as the principal inferential test of contextual heterogeneity.
3.4.3 Privacy
The interaction-level privacy audit included 270 observations: 10 scenarios and three scenarios per category, three runs, and three model conditions. Scenarios included unnecessary personally identifiable information, accidental disclosure, student records, data about minors, sensitive personal data, data minimization, consent, redaction, requests for deletion, and third-party sharing. The interaction score was based on correct warnings, avoiding unnecessary requests for PII, redaction suggestions, not repeating sensitive information, safer alternatives, consent clarity and data minimisation. The policy component included 12 criteria for each model condition, which were scored 0 (absent), 1 (partial) or 2 (full). The privacy pillar was a mix of 70% interaction behavior and 30% policy transparency. The public analysis file contains only the criterion-level policy scores and not the provider policy documents or the coder-level metadata; thus, the analysis assumes that they are source-provided governance indicators and does not make product-specific policy claims.
3.4.4 Pedagogical Value
Learner-level outcomes were baseline, revised, immediate-transfer, and delayed-transfer scores. Revision gain was defined as revised score – baseline score, and transfer gains were defined likewise. Feedback uptake, satisfaction, cognitive load, trust and completion-time indicators were also included in the dataset. Pedagogical value was a combination of 55% mean pedagogical quality and 45% normalized mean transfer gain; the transfer component was defined as 50 + 5 x mean transfer gain, with a bound between 0 and 100 at the model level. This focus on independent transfer is based on the idea that feedback in education should help students to perform better than the task being demonstrated or assisted. One Assigned_Model is recorded for each learner-profile record in the archived outcome file, but this allocation was not carried out or independently verified by the present authors. Learner-outcome models are thus understood as associations in the archived data that are adjusted for the effects of the covariate, but not necessarily causal treatment-effect estimates.
Table 3
Operationalization of the Four Benchmark Pillars
| Pillar | Operational Definition | Primary Indicators | Model-Level Rule |
|---|---|---|---|
| Validity | Accuracy and defensibility of AI judgments | F1; score agreement; relevance; cultural sensitivity; consistency; hallucination and bias control | Weighted 0–100 composite |
| Equity | Stability and absence of avoidable subgroup disadvantage | Country × model interaction; country, gender, and SES gaps; bias rate | Penalty-based 0–100 composite plus disaggregated gaps |
| Privacy | Observable safeguards and governance transparency | Warnings; PII avoidance; redaction; non-repetition; safe alternatives; consent; minimization; 12 policy criteria | 70% interaction audit + 30% policy transparency |
| Pedagogical value | Feedback quality and independent learning benefit | Relevance; clarity; actionability; scaffolding; agency; cultural sensitivity; revision and transfer | 55% quality + 45% normalized transfer |
Note. Composite weights were encoded in the archived codebook. They are design assumptions that are prespecified and not necessarily universally validated cut points, and should be interpreted in conjunction with the underlying component measures.
3.5 Statistical Analysis
Descriptive statistics and 95% confidence intervals were used for summarizing model-evaluation and learning-outcome measures. Two-way random-effects absolute-agreement ICCs with 1,000 bootstrap resamples of the learner-level (ICC(A,1) and ICC(A,3)) were used to estimate run stability. Validity, pedagogical quality, F1, score agreement and run consistency were compared across the same 960 profiles with repeated-measures ANOVA, with Holm adjusted paired contrasts and within-profile standardized mean differences (dz) reported.
Mixed ANOVA was used to test contextual heterogeneity (country as between-profile factor with eight levels, model as within-profile factor with three levels) and country-specific gaps were described. HC3 covariance models were used to analyse revision, immediate-transfer and delayed-transfer outcomes, with adjustment for baseline score, digital literacy, CEFR level, country, gender, socioeconomic status, urbanicity and institution type. Marginal means were adjusted and contrasts were Holm-corrected following robust Wald tests.
Repeated-measures ANOVA was used to compare privacy scores among the 90 matched units of scenario runs. Friedman tests were used to analyse the 12 paired ordinal policy criteria, followed by Pratt adjusted Wilcoxon comparisons with Holm correction. The deployment rule had all four pillars set to 70, and thresholds between 65 and 80 as well as alternative privacy (60/40–80/20) and pedagogical (50/50–60/40) weights were tested for sensitivity. Delta and partial R-squared were used to determine the incremental contribution of AI condition to the outcome models. The level of statistical significance was defined as alpha = .05 and the focus was on effect sizes, uncertainty, and practical significance (Saltelli et al., 2020).
4. Results
4.1 Dataset Profile
The analysis-ready dataset was complete and balanced by country, CEFR level, socioeconomic tertile and assigned AI condition. There were 120 records from each country, 240 records for each CEFR level and 320 learning-outcome records for each assigned AI condition. This balance is a result of the preprocessing of the datasets, which involved class balancing using SMOTE, and thus should not be confused as the actual prevalence of these groups in the underlying populations.
Model_A had the highest mean validity score (M = 85.87, SD = 3.77), followed closely by Model_B (M = 85.42, SD = 3.83), whereas Model_C scored lower (M = 78.81, SD = 4.65). The repeated-measures model effect was large, F(2, 1918) = 1522.14, p < .001, partial eta-squared = .614. The Model_A-Model_B difference was statistically detectable but small in standardized magnitude: 0.45 points, 95% CI [0.19, 0.72], t(959) = 3.33, Holm-adjusted p = .001, dz = 0.11. In contrast, the Model_A-Model_C and Model_B-Model_C differences were 7.06 points, 95% CI [6.77, 7.35], dz = 1.56, and 6.61 points, 95% CI [6.32, 6.90], dz = 1.45, respectively, both p < .001.
Model differences were explained by the component level results. The highest F1 error-detection score (M = .839) and actionability score (85.86) was obtained for Model_A. Model_B achieved the highest scores for agreement (95.04), learner agency (84.01) and cultural sensitivity (84.88) as well as the lowest hallucination and bias scores. The performance of Model_C was generally lower and the hallucination and bias incidence was the highest. Pedagogical quality differed markedly across conditions, F(2, 1918) = 11523.05, p < .001, partial eta-squared = .923, with means of 82.33 for Model_A, 81.93 for Model_B, and 72.36 for Model_C.
Table 4
Validity, Stability, and Pedagogical-Quality Performance by Model
| Model | F1 M (SD) | Score Agreement | Run Consistency | Validity M (SD) | Pedagogical Quality | Halluc. mean | Bias Rate |
|---|---|---|---|---|---|---|---|
| Model_A | 0.839 (0.074) | 94.84 | 83.60 | 85.87 (3.77) | 82.33 | 0.215 | 2.74% |
| Model_B | 0.825 (0.074) | 95.04 | 82.14 | 85.42 (3.83) | 81.93 | 0.164 | 1.08% |
| Model_C | 0.762 (0.090) | 91.20 | 78.72 | 78.81 (4.65) | 72.36 | 0.351 | 5.52% |
Note. Evaluation n = 960 per model. The scales for score agreement, run consistency, validity and pedagogical quality are 0–100. Hallucinations are mean number of incidents per evaluation record and bias rate is the percentage of runs that had an incident flagged.
Limited reliability of run levels. Single-run F1 reliability was ICC(A,1) = .257 for Model_A (bootstrap 95% CI [.190, .327]), .176 for Model_B [.115, .236], and .245 for Model_C [.199, .288]. Reliability for the mean of three generations was higher: ICC(A,3) = .509 for Model_A [.413, .594], .390 for Model_B [.280, .480], and .493 for Model_C [.427, .549]. Repeated outputs thus enhanced reliability but there was significant stochastic variation. Run consistency also differed across models, F(2, 1918) = 83.25, p < .001, partial eta-squared = .080. The results provide evidence for repeated generation and explicit reporting of uncertainty, as opposed to using a single model output as a stable measurement.
4.3 Cross-National Equity
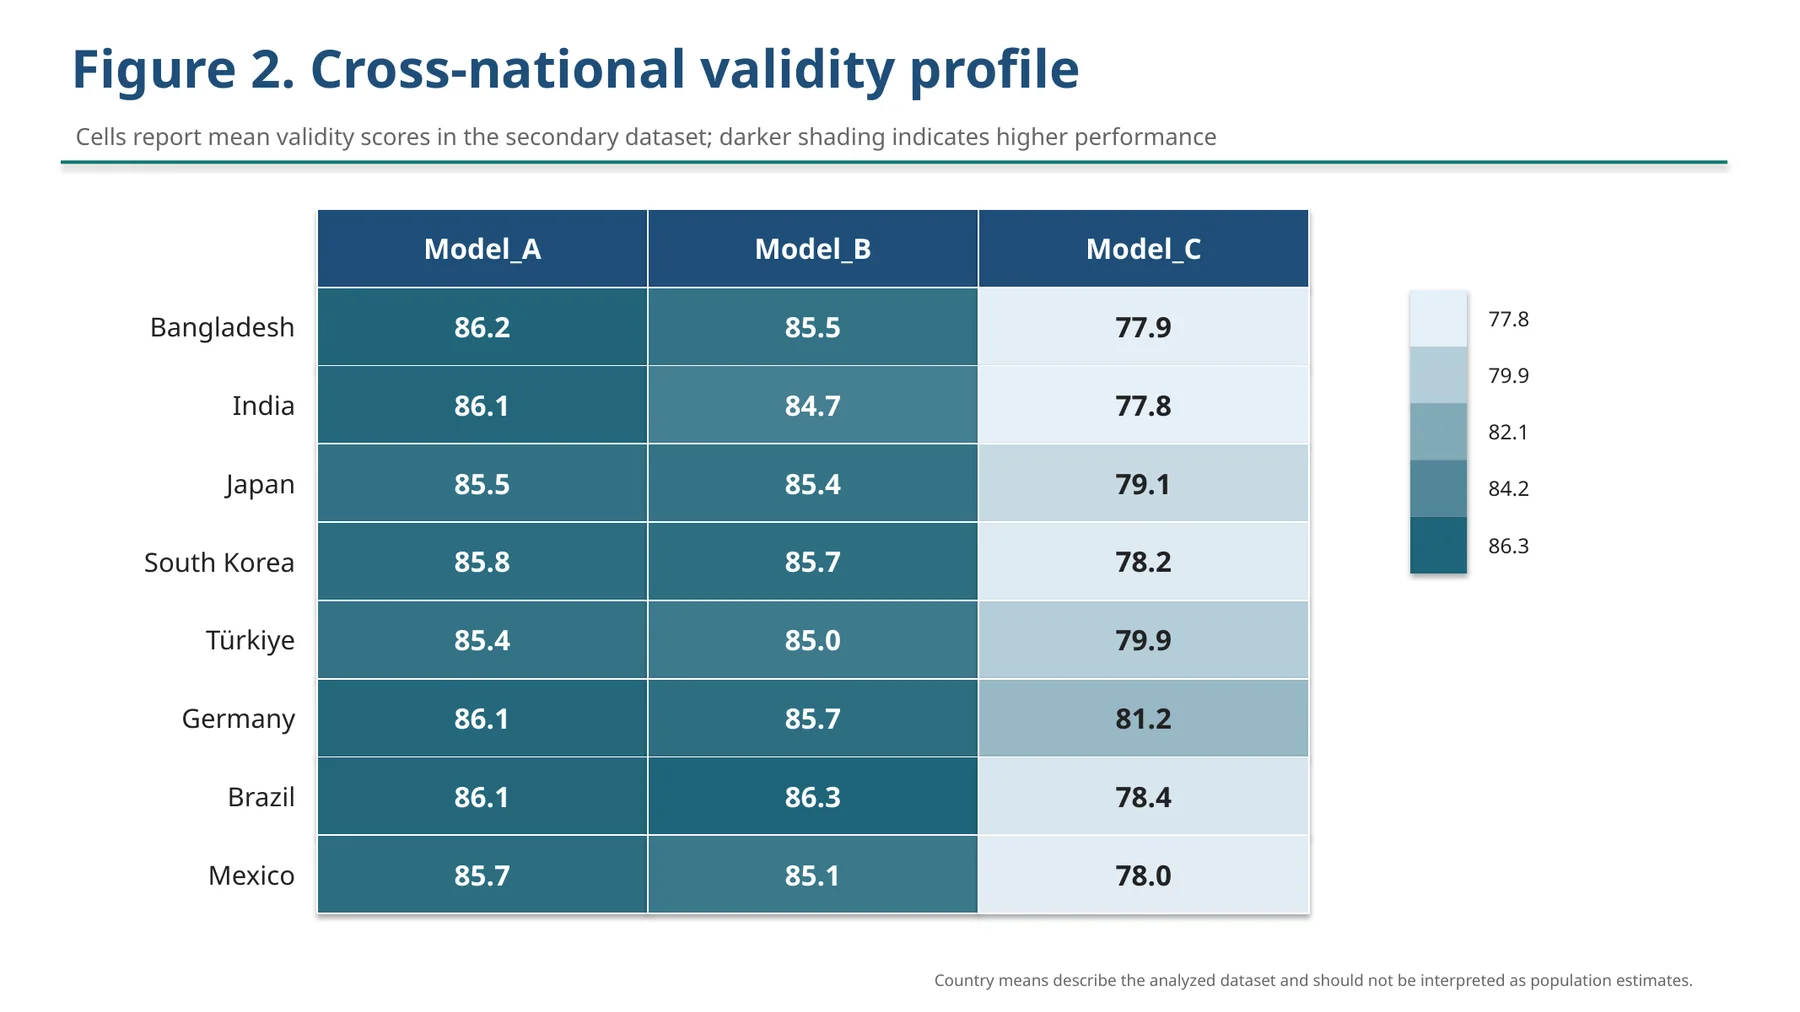
The mixed ANOVA identified a small country main effect on validity, F(7, 952) = 2.40, p = .020, partial eta-squared = .017; a large model effect, F(2, 1904) = 1594.58, p < .001, partial eta-squared = .626; and a country-by-model interaction, F(14, 1904) = 7.52, p < .001, partial eta-squared = .052. The interaction suggests that the relative performance of the models was not the same in the eight national-context groups. For Model_A, the best-worst country gap was 0.80 points, and there was no significant within-model country effect, F(7, 952) = 0.74, p = .639. Model_B showed a 1.66-point gap and a small country effect, F(7, 952) = 2.18, p = .034, eta-squared = .016. Model_C showed the largest gap, 3.36 points, and the strongest country effect, F(7, 952) = 8.40, p < .001, eta-squared = .058.
Table 5
Equity Profile by Model
| Model | Country Gap | Gender Gap | SES Gap | Bias Rate | Equity Index | Lowest Country | Highest Country |
|---|---|---|---|---|---|---|---|
| Model_A | 0.80 | 0.42 | 0.59 | 2.74% | 92.86 | Türkiye (85.44) | Bangladesh (86.23) |
| Model_B | 1.66 | 0.46 | 0.59 | 1.08% | 90.50 | India (84.67) | Brazil (86.33) |
| Model_C | 3.36 | 0.26 | 1.01 | 5.52% | 80.15 | India (77.81) | Germany (81.17) |
Note. Gaps = the maximum minus the minimum of the subgroup means for validity-score points. Country effects are the dataset being analysed, and are not to be interpreted as causal differences between countries or population estimates.
Note. Validity scores are displayed for cells in the secondary data set. The large country-by-model interaction is reflected in the stronger contextual gradient for Model_C. Country means describing the records analyzed, and are not estimates of national populations.
The interaction result is visually confirmed in figure 2. Model_A is highly concentrated in the various contexts, while Model_C is more spread out, with the highest mean in Germany and the lowest mean in India. The pattern does not indicate a hierarchy of national populations, but rather a contextual heterogeneity within the benchmark.
4.4 Privacy Safeguards and Policy Transparency
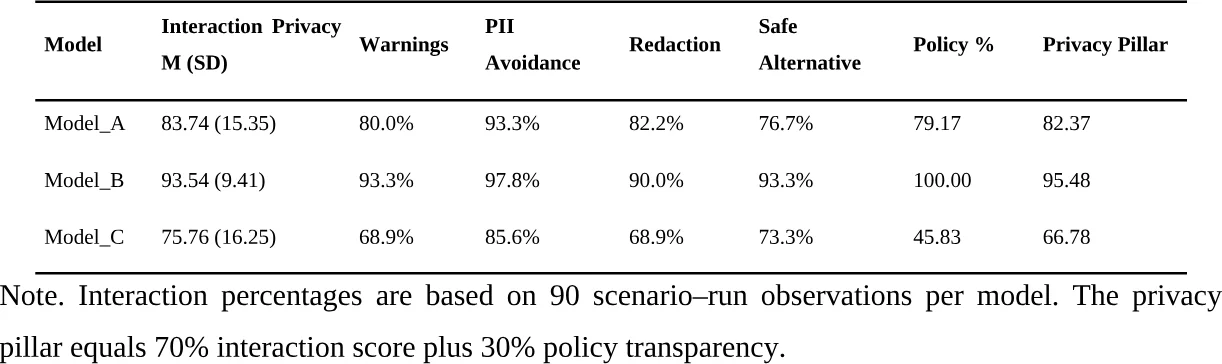
There were significant differences between interaction-level privacy scores for model conditions, F(2, 178) = 40.98, p < .001, partial eta-squared = .315. Model_B achieved the highest score (M = 93.54, SD = 9.41), followed by Model_A (M = 83.74, SD = 15.35) and Model_C (M = 75.76, SD = 16.25). In paired comparisons, Model_B exceeded Model_A by 9.80 points, 95% CI [6.11, 13.48], dz = 0.55, and Model_C by 17.78 points, 95% CI [13.83, 21.73], dz = 0.93. Model_A exceeded Model_C by 7.99 points, 95% CI [4.06, 11.92], dz = 0.42. The Holm corrected comparisons were all significant.
On most indicators, the safeguard profile preferred Model_B. It provided an appropriate warning in 93.3% of runs, an unnecessary PII request in 2.2%, a redaction recommendation in 90.0%, repeated sensitive information in 4.4% and a safer alternative in 93.3%. 80.0% of Model_A runs and 68.9% of Model_C runs had appropriate warnings, while 6.7% and 14.4% respectively had unnecessary PII requests. Model_B also got the highest score for consent-clarity and data-minimization. The ranking was the same with respect to policy transparency: Model_B (100.00%), Model_A (79.17%) and Model_C (45.83%). Friedman test was significant, chi-square(2) = 18.86, p < .001, and all three Holm adjusted pairwise comparisons were significant. Models B, A, and C had composite privacy scores of 95.48, 82.37, and 66.78, respectively
Table 6
Privacy Audit Results
| Model | Interaction Privacy M (SD) | Warnings | PII Avoidance | Redaction | Safe Alternative | Policy % | Privacy Pillar |
|---|---|---|---|---|---|---|---|
| Model_A | 83.74 (15.35) | 80.0% | 93.3% | 82.2% | 76.7% | 79.17 | 82.37 |
| Model_B | 93.54 (9.41) | 93.3% | 97.8% | 90.0% | 93.3% | 100.00 | 95.48 |
| Model_C | 75.76 (16.25) | 68.9% | 85.6% | 68.9% | 73.3% | 45.83 | 66.78 |
Note. Interaction percentages are based on 90 scenario–run observations per model. The privacy pillar equals 70% interaction score plus 30% policy transparency.
Note. Binary safeguards are given as percentages. The scores for consent clarity and data minimization were transformed to a percentage scale by multiplying the original 1-5 scores by 20. The higher the value the stronger the protection.
As seen in Figure 4, the privacy advantage of Model_B is not limited to just one safeguard, but is found throughout; Model_C is generally the weakest, with a comparatively strong score for non-repetition.
4.5 Pedagogical Outcomes
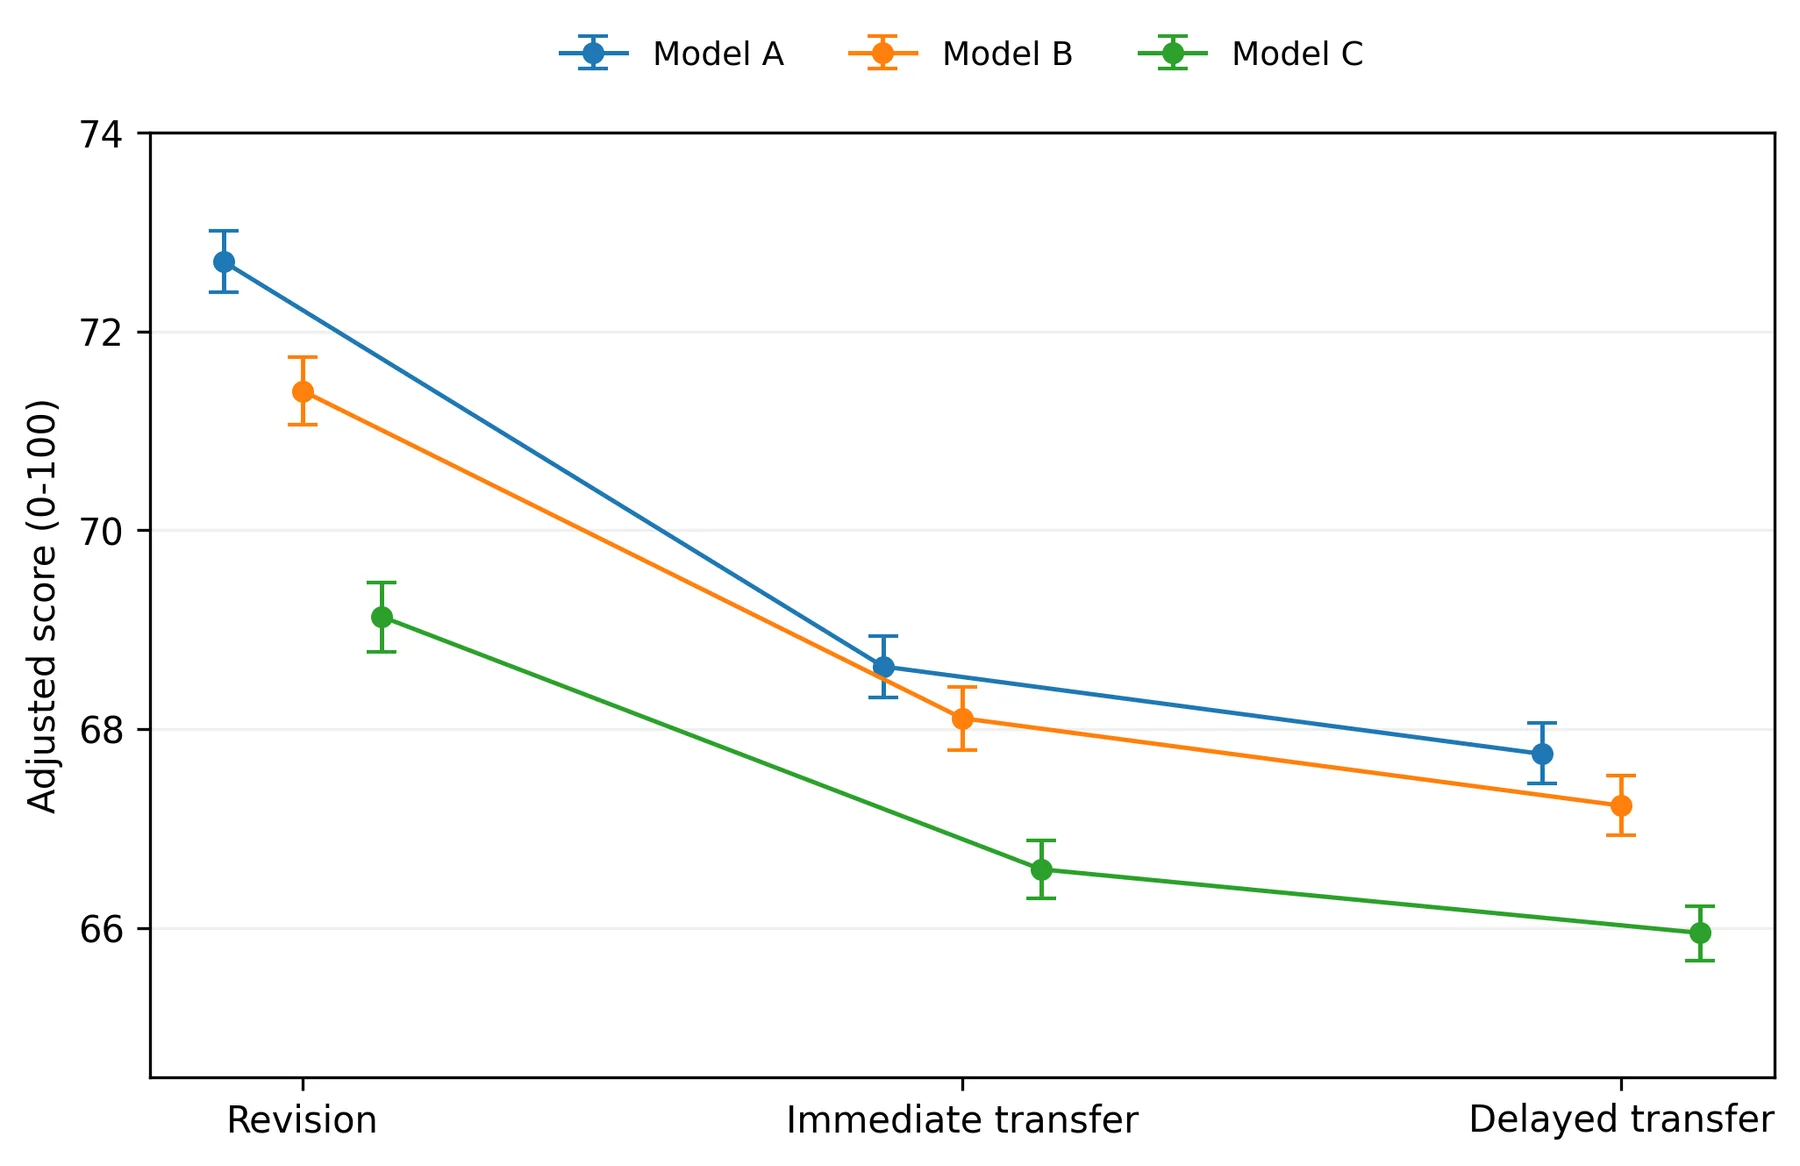
There was a well-defined rank order of unadjusted gains. Records associated with Model_A showed the largest revision gain (M = 9.14, SD = 2.85), followed by Model_B (M = 7.86, SD = 3.03) and Model_C (M = 5.56, SD = 3.11). The mean gains for immediate transfer were 5.08, 4.53 and 3.05 points, respectively. The HC3 adjusted model for the revised score accounted for 96.0% of the variance in the outcome and was jointly significant, Wald chi-square(2) = 224.40, p < .001. The adjusted revised-score means were 72.70, 71.40, and 69.13 for Model_A, Model_B, and Model_C, respectively. All pairwise contrasts were significant: A-B = 1.30 points, 95% CI [0.84, 1.76]; A-C = 3.57, 95% CI [3.10, 4.04]; and B-C = 2.27, 95% CI [1.78, 2.76]. These are not causal treatment effects but rather adjusted associations in the secondary data that has been archived.
Differences were less for independent transfer. For immediate transfer, the robust joint test was chi-square(2) = 95.29, p < .001, R-squared = .967, with adjusted means of 68.63 for Model_A, 68.11 for Model_B, and 66.59 for Model_C. Model_A exceeded Model_B by 0.53 points, 95% CI [0.08, 0.97], Holm-adjusted p = .020; the A-C and B-C contrasts were 2.04 and 1.51 points, respectively, both p < .001. Delayed transfer showed the same rank order, chi-square(2) = 79.22, p < .001, R-squared = .970, with adjusted means of 67.75, 67.23, and 65.95. The difference between the Model_A and Model_B was statistically significant, but small: 0.52 points, 95% CI [0.10, 0.95].
Table 7
Adjusted Learning Outcomes and Pairwise Contrasts
| Outcome | Adjusted M [95% CI] | A − B | A − C | B − C | R² |
|---|---|---|---|---|---|
| Revision | A = 72.70 [72.39, 73.01]; B = 71.40 [71.06, 71.74]; C = 69.13 [68.78, 69.47] | 1.30 [0.84, 1.76] | 3.57 [3.10, 4.04] | 2.27 [1.78, 2.76] | 0.960 |
| Immediate transfer | A = 68.63 [68.32, 68.94]; B = 68.11 [67.79, 68.42]; C = 66.59 [66.30, 66.88] | 0.53 [0.08, 0.97] | 2.04 [1.61, 2.47] | 1.51 [1.08, 1.95] | 0.967 |
| Delayed transfer | A = 67.75 [67.45, 68.06]; B = 67.23 [66.93, 67.53]; C = 65.95 [65.67, 66.22] | 0.52 [0.10, 0.95] | 1.80 [1.39, 2.22] | 1.28 [0.87, 1.69] | 0.970 |
Note. HC3 models were adjusted for baseline score, digital literacy, CEFR level, country, gender, SES, urbanicity and institution type. Holm adjusted p < .001 for all A–C and B–C comparisons. A–B was significant for revision (p < .001), immediate transfer (p = .020) and delayed transfer (p = .016).
Note. Points show HC3-adjusted marginal means; whiskers show 95% confidence intervals. Models adjusted for baseline score, digital literacy, CEFR level, country, gender, SES, urbanicity, and institution type.
Figure 5 shows a stable ordering but a narrowing gap from revision to transfer: Model_A's advantage is largest for assisted revision and much smaller for immediate and delayed independent transfer.
4.6 Integrated Deployment Decision
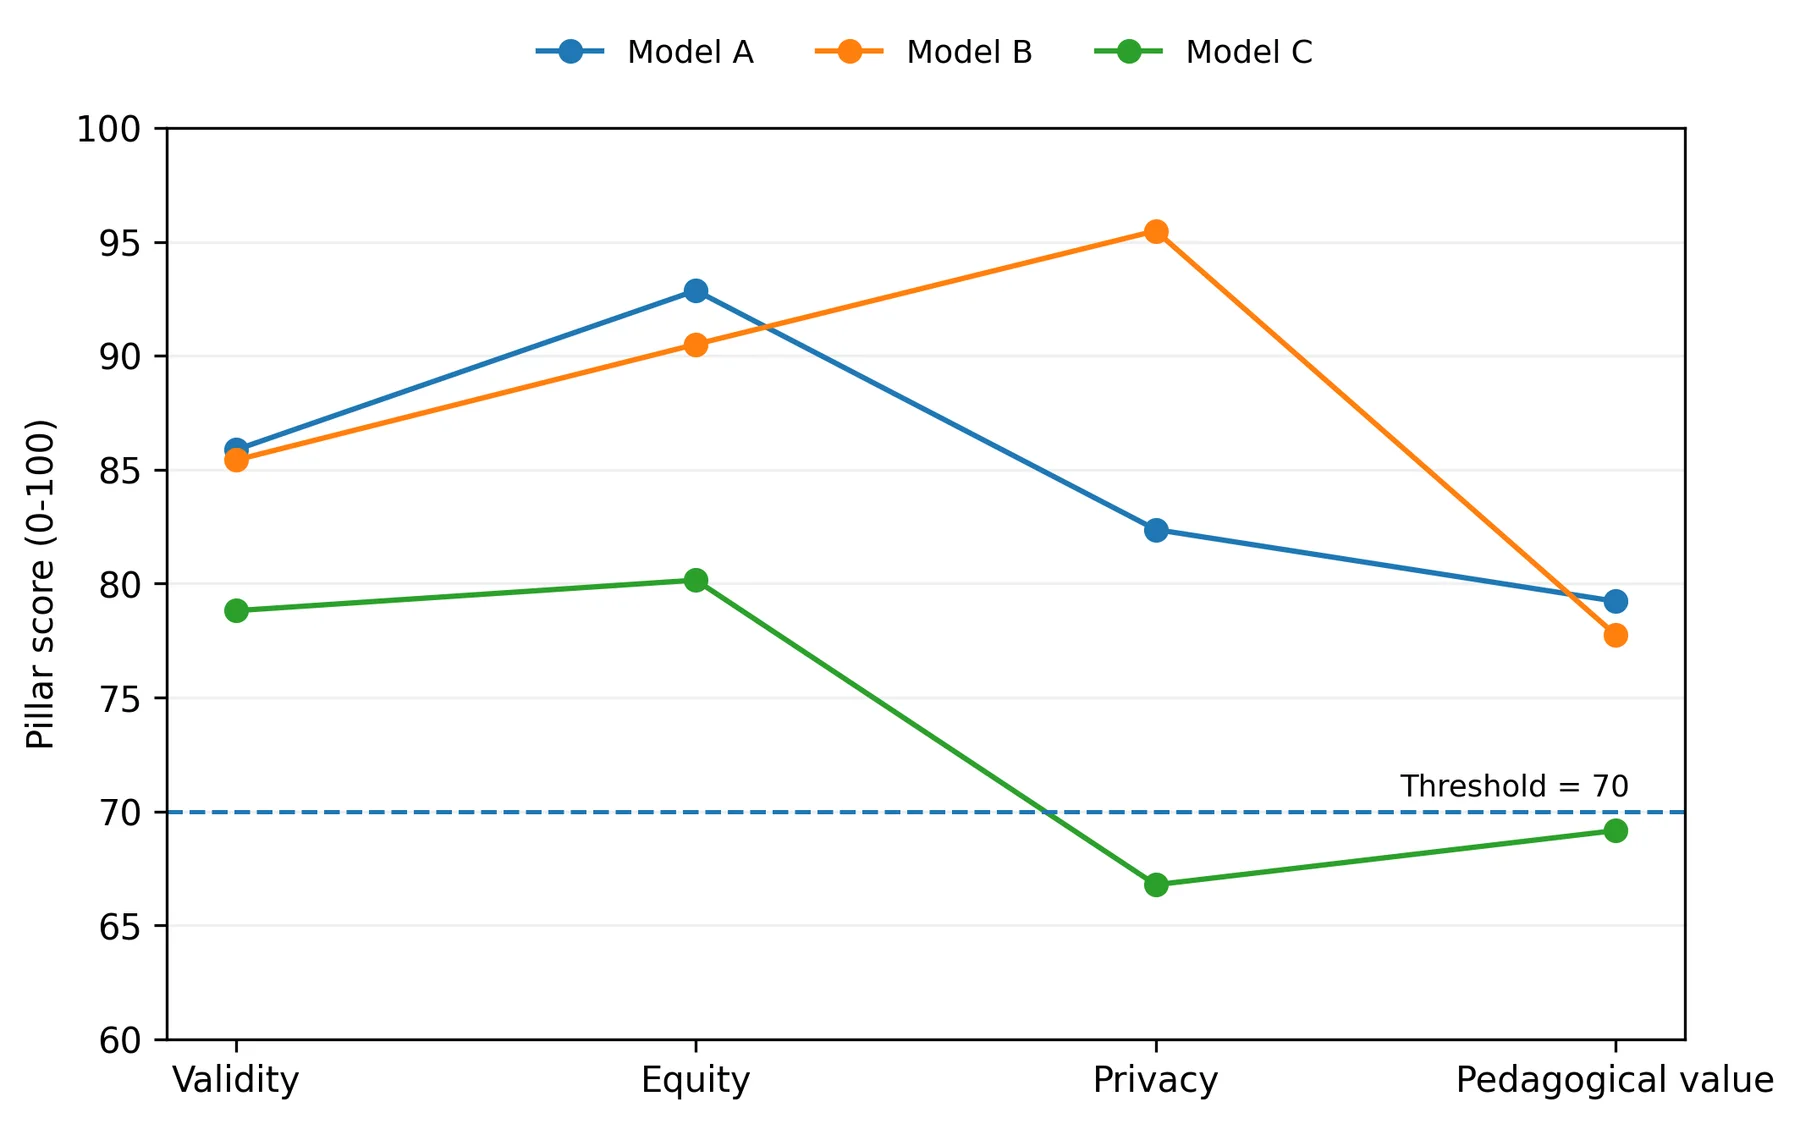
Model_A and Model_B met the non-compensatory rule at the prespecified threshold value of 70 and Model_C failed to do so. The lowest pillar for Model_A was pedagogical value (79.22) and for Model_B it was also pedagogical value (77.75). Model_C was below the criterion for privacy (66.78) and pedagogical value (69.16). What is important is that even though Model_B did not get the highest validity and learning-outcome score, it had a much stronger privacy profile and was able to meet the four-pillar criterion. On the other hand, the low scores for privacy and pedagogical-value were unable to be offset by the validity and equity scores. The decision is based on the full profile and not an average over pillars.
4.7 Threshold Sensitivity
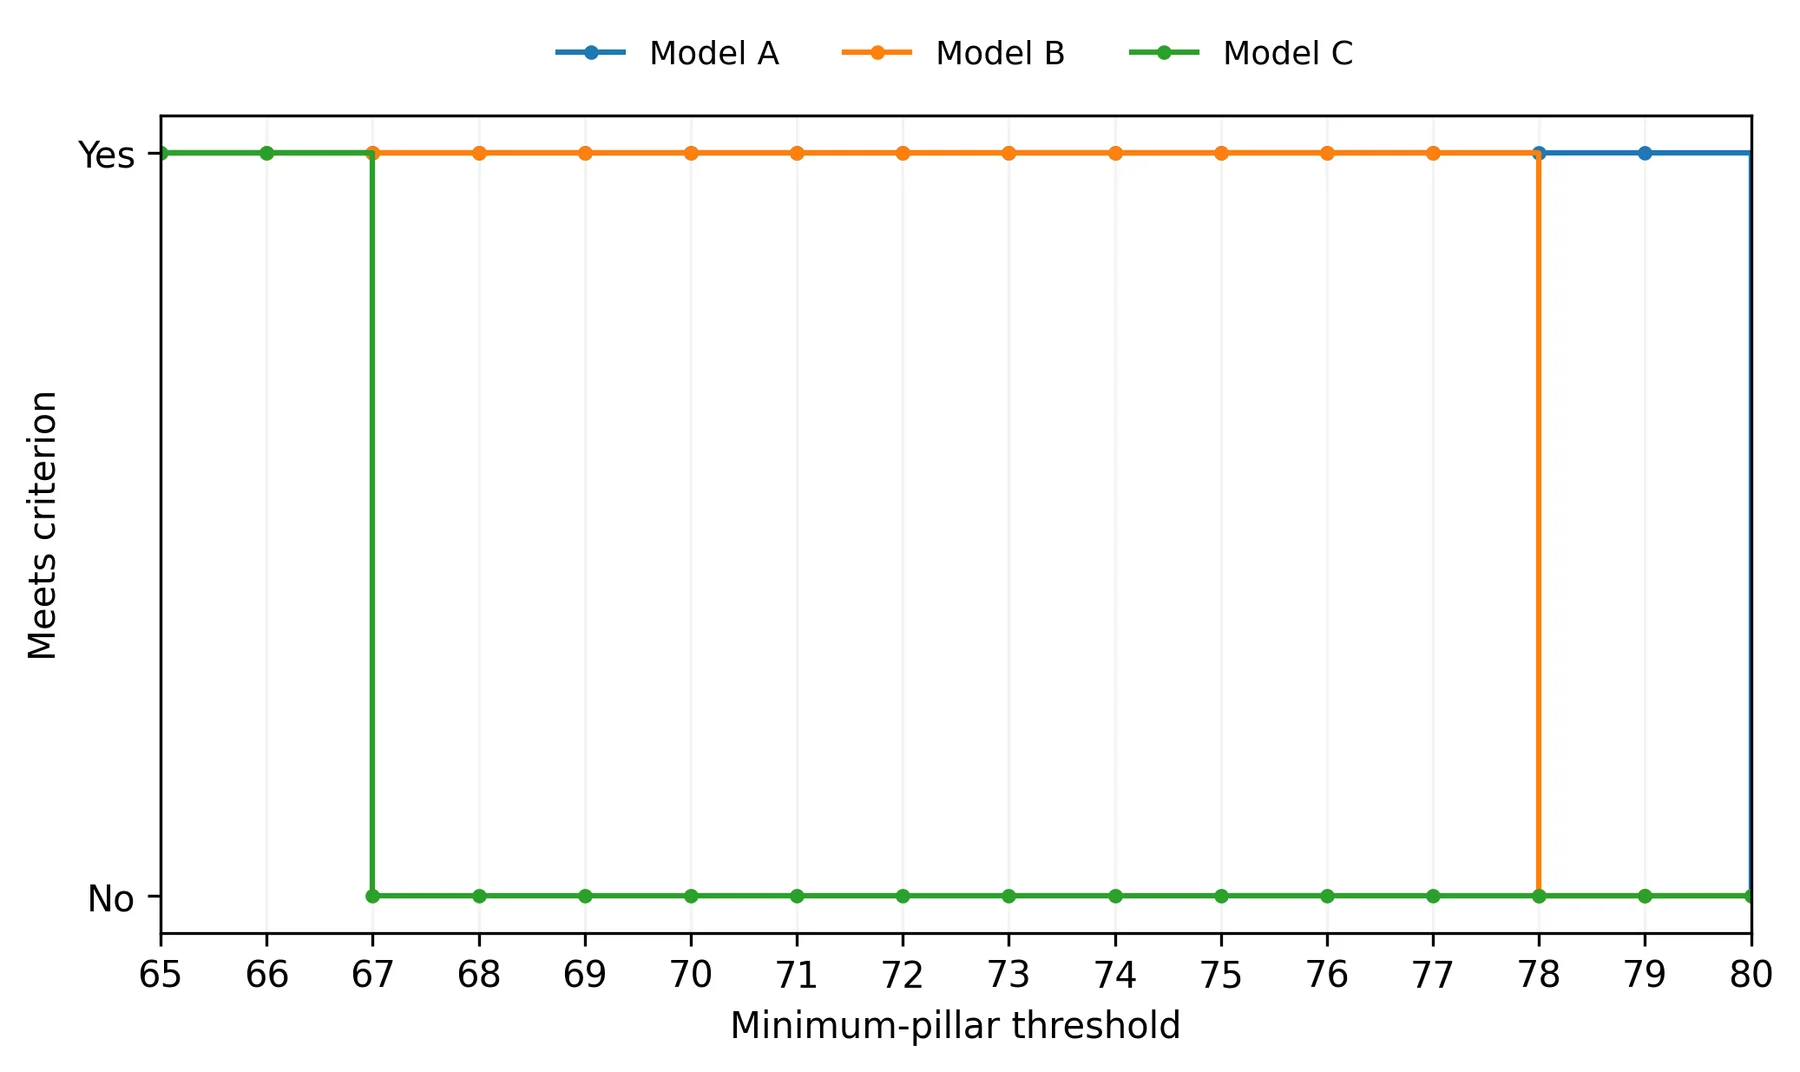
The deployment classification was changed due to an increase in the normative threshold. All three model conditions were met the minimum-pillar criterion at the thresholds of 65 and 66. Between 67 and 77, Model_A and Model_B passed the test, but Model_C failed to pass. Only Model_A met the criterion at a threshold of 78 and 79, while none of the conditions met the criterion at a threshold of 80. These findings indicate that deployment classifications are partially based on the standard used. Thresholds should therefore be determined a priori, sensitivity analysis performed, and thresholds should be regarded as decision rules, not objectively determined cut points from the same data.
Table 8
Four-Pillar Deployment Profile
| Model | Validity | Equity | Privacy | Pedagogical Value | Minimum | Threshold 70 |
|---|---|---|---|---|---|---|
| Model_A | 85.87 | 92.86 | 82.37 | 79.22 | 79.22 | Meets |
| Model_B | 85.42 | 90.50 | 95.48 | 77.75 | 77.75 | Meets |
| Model_C | 78.81 | 80.15 | 66.78 | 69.16 | 66.78 | Below |
Note. The decision rule is non-compensatory: every pillar must equal or exceed the prespecified threshold of 70.
Note. The horizontal reference represents the minimum-pillar threshold that was prespecified, which is 70. A model condition can only be considered as compliant with the benchmark criterion if all pillars are at or above the threshold.
The non-compensatory rule is apparent in figure 6. Both Models A and B are above the 70-point line on all pillars, but in different ways: Model_A is better on validity and equity, while Model_B is better on privacy. Model_C is below the criterion on privacy and pedagogical value.
Note. If the model condition's minimum pillar value met the stated threshold, then a value of 'Yes' is returned. Thresholds were varied from 65 to 80.
The margin of robustness is shown in figure 6. Model_C fails the rule above 66, Model_B above 77 and Model_A above 79; none is above 80. The main classification is thus stable at 70, but not at significantly tighter standards.
4.8 Robustness of Weighting Assumptions and Model Contribution
The deployment classification was found to be robust against plausible changes of the two composite weight structures tested. Varying the interaction/policy weighting from 60/40 to 80/20 resulted in modest changes in the pillar scores, but did not affect the ordering of the pillars: Model_B was still the highest, Model_A was still above the deployment threshold, and Model_C was still below 70. The classification remained the same when the quality/transfer weighting was changed to 60/40 or 50/50 for pedagogical value. In all of the tested weight combinations, Models A and B passed the 70-point minimum-pillar rule, while Model C failed. This suggests that the main deployment finding is not a consequence of the particular 70/30 privacy or 55/45 pedagogical split in the primary specification.
Table 9
Weight-Sensitivity Analysis for Privacy and Pedagogical Value
| Model | Privacy 60/40 | Privacy 70/30 | Privacy 80/20 | Pedagogy 50/50 | Pedagogy 55/45 | Pedagogy 60/40 |
|---|---|---|---|---|---|---|
| Model_A | 81.91 | 82.37 | 82.83 | 78.88 | 79.22 | 79.57 |
| Model_B | 96.12 | 95.48 | 94.83 | 77.29 | 77.75 | 78.22 |
| Model_C | 63.79 | 66.78 | 69.77 | 68.81 | 69.16 | 69.52 |
Note. The privacy weights are related to the interaction behavior/policy transparency, while the pedagogical weights are related to the feedback quality/normalized transfer. The deployment threshold is set at 70 for each pillar, as specified in the model.
The very high total R-squared values in the learning-outcome models were investigated by removing the contribution of AI condition from the other covariates. When AI condition was removed R-squared decreased .0097 for revision, .0033 for immediate transfer, and .0025 for delayed transfer. The partial R-squared values were .195, .091 and .077, respectively. Therefore, the baseline and contextual covariates explained the majority of the total explained variance, and the AI condition explained a smaller, but not negligible, proportion of the variance above and beyond the baseline and contextual covariates, particularly for revision but not independent transfer.
Table 10
Incremental Explanatory Contribution of AI Condition
| Outcome | Full R-squared | R-squared without AI condition | Delta R-squared | Partial R-squared |
|---|---|---|---|---|
| Revision | .9602 | .9505 | .0097 | .195 |
| Immediate transfer | .9670 | .9638 | .0033 | .091 |
| Delayed transfer | .9695 | .9670 | .0025 | .077 |
Note. Baseline score, digital literacy, CEFR level, country, gender, SES, urbanicity and institution type were maintained in reduced models. Partial R-squared = (R-squared_full - R-squared_reduced) / (1 - R-squared_reduced).
5. Discussion
5.1 Principal Findings
The benchmark resulted in a profile-based not a universal ranking. Model_A outscored on validity, error detection, actionability and adjusted learning outcomes; Model_B was almost as strong on validity but significantly stronger on privacy, learner agency, cultural sensitivity, hallucination control and bias incidence; Model_C was weaker and more context-sensitive. The comparison of Model_A and Model_B is particularly instructive: Model_A was only 0.45 points (dz = 0.11) less valid than Model_B, which gained some 13 points on the privacy measure. Selection should thus be responsible, depending on the educational purposes and the risks that are not acceptable.
The robustness analyses support this interpretation. There were no differences in deployment classification between the tested privacy and pedagogical weighting schemes, and the incremental R-squared analysis indicated that AI condition added more unique variance in revision than in immediate or delayed transfer. The benchmark thus provides insights about the compromises between requirements for responsible AI and the distinction between statistically measurable model effects and their educational impact.
5.2 Comparison With Prior Research
The results do not contradict previous research in the field of AI feedback but rather support it. (Escalante et al., 2023) concluded that there was no increase in language proficiency, and (Mahapatra, 2024) concluded that there was an improvement when ChatGPT was integrated into guided instruction. The current pattern is able to reconcile these results, with the Model_A being more beneficial to revision than to unaided transfer, implying that good artefacts are not necessarily good for durable learning. The study also expands L2-Bench to incorporate contextual equity, privacy behavior, policy transparency, repeated-output reliability, and learner outcomes (Edgell et al., 2026)and operationalizes the sociotechnical focus of pedagogy, agency, and governance in RAiLE (Khodi & Curle, 2026)
5.3 Validity Requires Repeated and Claim-Specific Evidence
Both Model_A and Model_B achieved comparable validity scores but with different component profiles: Model_A had higher scores on F1 and actionability, while Model_B had higher scores on score agreement, cultural sensitivity, and hallucination control. This allows for interpretation at the level of the claim and not based on one composite. A writing center might value feedback and student voice, while assessment contexts might value agreement and consistency
Further findings on reliability question the single-output assessment. Despite three generations averaging, F1 reliability was low to moderate. Benchmarks that rely on a single output per task can partially capture sampling noise, as the output can depend on the prompt, the decoding hyperparameters, the context, and new versions of the model. This means repetition of inference, run-level uncertainty, and documentation of prompts and settings over time, particularly in the lead-up to any high-stakes educational use (Edgell et al., 2026)
5.4 Equity Must Be Disaggregated
The country by model interaction indicates that the contextual robustness was different across conditions: Model_A was relatively stable across the eight national-context groups, while Model_C was less stable. This is significant in language teaching as task interpretation, reference expectations, first-language influence and legitimate English varieties may impact model behavior, and fluent systems are still able to reproduce linguistic hierarchies (Fleisig et al., 2024)
These country categories are not representative national samples, nor causal explanations. Differences can be due to differences in the construction of the datasets, familiarity with the prompts, differences in reference scoring, or unmeasured language-background factors. Therefore, the interpretation of equity should not be based on a single fairness index, but should include the worst group performance, model-by-context interactions, and disaggregated gaps. Locally informed raters, measurement-invariance or differential-functioning analyses, and intersectional subgroup review would be useful for future validation.
5.5 Privacy Can Reverse a Performance Ranking
Privacy produced the clearest trade-off. Model_B was not the strongest condition on every educational measure, but it led on interaction safeguards and policy transparency. A validity-only ranking would therefore favor Model_A, whereas a multidimensional institutional decision could reasonably favor Model_B. This is consistent with NIST (2023, 2024) and UNESCO (2023), which treat privacy and governance as independent trustworthiness requirements.
The audit design also makes privacy operational: institutions can test whether systems request unnecessary identifiers, recommend redaction, avoid repeating sensitive data, and respond safely to inadvertent disclosure, while separately reviewing retention, training use, deletion, third-party access, and protections for minors. Such audits should use non-identifiable scenarios, because strong feedback quality does not itself demonstrate safe data behavior (Liu & Khalil, 2023; Mutimukwe et al., 2022).
5.6 Pedagogical Value Extends Beyond Revision
Records for Model_A had the best adjusted revision and transfer results, while the benefit of Model_A compared to Model_B decreased significantly for immediate and delayed transfer. This separation is important because an AI system can enhance an existing text without guaranteeing that the learner grasps the principle. The theory of formative feedback also considers feedback to be education when it is interpreted, decisions are made and the next action is regulated (Carless & Boud, 2018; Nicol & Macfarlane‐Dick, 2006)The pattern can help explain mixed results in the literature on interventions: the extent of the impact may not be as much about AI as it is about how feedback is presented, discussed, and applied (Escalante et al., 2023; Mahapatra, 2024)Responsible evaluation should therefore not only be based on revision quality, but should also involve unaided transfer, delayed performance, learner uptake and teacher mediation.
5.7 Implications for Research, Practice, and Governance
The framework proposes a process for research that is reproducible: 1) define the educational claim, 2) employ authentic tasks, 3) set reference criteria, 4) repeat the inference, and 5) report validity, equity, privacy, and evidence of learning separately prior to implementing a decision rule. For composite weights and thresholds, these must be defined a priori and include component profiles, confidence intervals and sensitivity analyses.
In terms of teaching, the outcomes are positive for supervised use, where the AI feedback is used as a suggestion and assessed, not taken as the correct answer. Learners should be able to ask questions for clarification, compare options, refuse unacceptable suggestions, and explain revisions. Student work should not be posted on public systems without institutional agreements and data-protection safeguards, unless it can be identified.
Institutions should have use-case specific procurement. A system used for low-stakes practice might not be suitable for recording and processing student records. Retention, training use, deletion, model updates, audit access, incident response and protections for minors should be addressed by governance. A minimum-pillar rule is helpful as it makes the non-negotiable safeguards an explicit constraint as per the sociotechnical view of (Khodi & Curle, 2026)
5.8 Limitations
First, it is a secondary analysis of a processed data set from Kaggle. Not all source-level provenance or preprocessing information needed to reconstruct the original collection and SMOTE procedure is included in the public file. Hence, resampled rows are considered as analytical records, the balanced counts are not population estimates, and inference can only be drawn on the archived benchmark.
Second, the eight national-context groups are not representative samples, and any differences observed could be due to the construction of the data sets, prompts, reference scoring, or unmeasured language-background factors. Third, the names Model_A, Model_B and Model_C are deliberately anonymized, which helps in provider-neutral interpretation, but makes it impossible to reproduce the products without provider, version, prompt and decoding, and test-date metadata.
Fourth, the composite weights and 70-point threshold are not universal cut points, but the tested weight variations did not affect the primary classification. Seventh, there are several source-level validation materials that are not available: expert-reference scores are not rater-level documented, policy ratings are not accompanied by documents and coder metadata, and raw learner texts and full AI transcripts are not archived. The original model-allocation for learning outcomes was also not independently verified, and outcome differences are interpreted associationally. Last but not least, the reliability of low to moderate runs indicates that three generations may not be enough for high stakes comparisons.
6. Conclusion and Future Scopes
Average accuracy is not sufficient to build responsible AI in language education. The four-pillar benchmark revealed that Model_A was the most valid and learning-oriented model, Model_B was the most privacy and governance-oriented model, and Model_C was not valid based on the pre-specified 70-point benchmark due to its scores for both privacy and pedagogical value being below the threshold. Evaluation that is repeated, disaggregated, and sensitive to educational use, further illustrates the need for contextual heterogeneity, limited run reliability, and the comparatively smaller contribution of AI condition to independent transfer. The main value of this study is thus not a single and universal ranking of commercial AI systems, but rather a transparent, multidimensional decision architecture.
The main takeaway is that the choice of educational AI should be made jointly on the basis of its validity, its robustness in subgroups, its privacy protections, its transfer of independent learning, and its sensitivity to explicit decision standards. Future studies should test the framework with larger and more representative cross-national data, with complete and up-to-date AI models, with original and unaltered source data, with verified expert ratings, and with classroom outcomes in the long term. Additional research is also needed to explore other weights and thresholds for the pillars, differences across intersectional and linguistic subgroups, shifts in model versions, teacher mediation, and the longer-term learning transfer to assess whether the benchmark is consistent across educational contexts and deployment conditions.
This validation would contribute to setting more research-based guidelines for the responsible use of AI in language education.
References
- Baker, R. S., & Hawn, A. (2022). Algorithmic Bias in Education. International Journal of Artificial Intelligence in Education, 32(4), 1052–1092. https://doi.org/10.1007/s40593-021-00285-9
- Boud, D., & Molloy, E. (2013). Rethinking models of feedback for learning: The challenge of design. Assessment & Evaluation in Higher Education, 38(6), 698–712. https://doi.org/10.1080/02602938.2012.691462
- Carless, D., & Boud, D. (2018). The development of student feedback literacy: Enabling uptake of feedback. Assessment & Evaluation in Higher Education, 43(8), 1315–1325. https://doi.org/10.1080/02602938.2018.1463354
- Chawla, N. V., Bowyer, K. W., Hall, L. O., & Kegelmeyer, W. P. (2002). SMOTE: Synthetic Minority Over-sampling Technique. Journal of Artificial Intelligence Research, 16, 321–357. https://doi.org/10.1613/jair.953
- Edgell, J., Kennedy, Wm. M., Knight, B., Carvalho, D., Ku, M., & Pattis, I. (2026). L2-Bench: An Evaluation Benchmark for Measuring LLM Capabilities in Second Language Education (Version 2). arXiv. https://doi.org/10.48550/ARXIV.2607.08842
- Escalante, J., Pack, A., & Barrett, A. (2023). AI-generated feedback on writing: Insights into efficacy and ENL student preference. International Journal of Educational Technology in Higher Education, 20(1), 57. https://doi.org/10.1186/s41239-023-00425-2
- Fleisig, E., Smith, G., Bossi, M., Rustagi, I., Yin, X., & Klein, D. (2024). Linguistic Bias in ChatGPT: Language Models Reinforce Dialect Discrimination. Proceedings of the 2024 Conference on Empirical Methods in Natural Language Processing, 13541–13564. https://doi.org/10.18653/v1/2024.emnlp-main.750
- Hattie, J., & Timperley, H. (2007). The Power of Feedback. Review of Educational Research, 77(1), 81–112. https://doi.org/10.3102/003465430298487
- Khodi, A., & Curle, S. (2026). Designing and governing generative AI for language education: A testable sociotechnical framework (RAiLE). Frontiers in Education, 11, 1806184. https://doi.org/10.3389/feduc.2026.1806184 Koç, F. Ş., & Savaş, P. (2025). The use of artificially intelligent chatbots in English language learning: A systematic meta-synthesis study of articles published between 2010 and 2024. ReCALL, 37(1), 4–21. https://doi.org/10.1017/S0958344024000168
- Law, L. (2024). Application of generative artificial intelligence (GenAI) in language teaching and learning: A scoping literature review. Computers and Education Open, 6, 100174. https://doi.org/10.1016/j.caeo.2024.100174
- Li, B., Tan, Y. L., Wang, C., & Lowell, V. (2025). Two years of innovation: A systematic review of empirical generative AI research in language learning and teaching. Computers and Education: Artificial Intelligence, 9, 100445. https://doi.org/10.1016/j.caeai.2025.100445
- Liu, Q., & Khalil, M. (2023). Understanding privacy and data protection issues in learning analytics using a systematic review. British Journal of Educational Technology, 54(6), 1715–1747. https://doi.org/10.1111/bjet.13388
- Lo, C. K., Yu, P. L. H., Xu, S., Ng, D. T. K., & Jong, M. S. (2024). Exploring the application of ChatGPT in ESL/EFL education and related research issues: A systematic review of empirical studies. Smart Learning Environments, 11(1), 50. https://doi.org/10.1186/s40561-024-00342-5
- Mahapatra, S. (2024). Impact of ChatGPT on ESL students’ academic writing skills: A mixed methods intervention study. Smart Learning Environments, 11(1), 9. https://doi.org/10.1186/s40561-024-00295-9
- Mutimukwe, C., Viberg, O., Oberg, L., & Cerratto‐Pargman, T. (2022). Students’ privacy concerns in learning analytics: Model development. British Journal of Educational Technology, 53(4), 932–951. https://doi.org/10.1111/bjet.13234 National Institute of Standards and Technology (US). (2024). Artificial intelligence risk management framework: Generative artificial intelligence profile (Error: 600-1; p. error: 600-1). National Institute of Standards and Technology (U.S.). https://doi.org/10.6028/NIST.AI.600-1
- Nicol, D. J., & Macfarlane‐Dick, D. (2006). Formative assessment and self‐regulated learning: A model and seven principles of good feedback practice. Studies in Higher Education, 31(2), 199–218. https://doi.org/10.1080/03075070600572090
- Pardo, A., & Siemens, G. (2014). Ethical and privacy principles for learning analytics. British Journal of Educational Technology, 45(3), 438–450. https://doi.org/10.1111/bjet.12152
- Saltelli, A., Bammer, G., Bruno, I., Charters, E., Di Fiore, M., Didier, E., Nelson Espeland, W., Kay, J., Lo Piano, S., Mayo, D., Pielke Jr, R., Portaluri, T., Porter, T. M., Puy, A., Rafols, I., Ravetz, J. R., Reinert, E., Sarewitz, D., Stark, P. B., … Vineis, P. (2020). Five ways to ensure that models serve society: A manifesto. Nature, 582(7813), 482–484. https://doi.org/10.1038/d41586-020-01812-9
- Shute, V. J. (2008). Focus on Formative Feedback. Review of Educational Research, 78(1), 153–189. https://doi.org/10.3102/0034654307313795
- Tabassi, E. (2023). Artificial Intelligence Risk Management Framework (AI RMF 1.0) (NIST AI 100-1; p. NIST AI 100-1). National Institute of Standards and Technology (U.S.). https://doi.org/10.6028/NIST.AI.100-1
- Zhang, Z. (Victor). (2020). Engaging with automated writing evaluation (AWE) feedback on L2 writing: Student perceptions and revisions. Assessing Writing, 43, 100439. https://doi.org/10.1016/j.asw.2019.100439
- Zhang, Z. (Victor), & Hyland, K. (2018). Student engagement with teacher and automated feedback on L2 writing. Assessing Writing, 36, 90–102. https://doi.org/10.1016/j.asw.2018.02.004 UNESCO. (2023). Guidance for generative AI in education and research. https://unesdoc.unesco.org/ark:/48223/pf0000386693 Data set link: https://www.kaggle.com/datasets/turzobrilliancy/responsible-ai-language-education-benchmark
CITE THIS ARTICLE
Sultana, S. (2026). A Cross National Benchmark for Responsible AI in Language Education: Validity, Equity, Privacy, and Pedagogical Value. https://www.researchbysayma.com/article/bb0e1e3f-1a86-417f-b8e1-3e84642b1eac
S. Sultana, “A Cross National Benchmark for Responsible AI in Language Education: Validity, Equity, Privacy, and Pedagogical Value,” 2026. [Online]. Available: https://www.researchbysayma.com/article/bb0e1e3f-1a86-417f-b8e1-3e84642b1eac
Sultana, S. (2026) ‘A Cross National Benchmark for Responsible AI in Language Education: Validity, Equity, Privacy, and Pedagogical Value’. Available at: https://www.researchbysayma.com/article/bb0e1e3f-1a86-417f-b8e1-3e84642b1eac
Sultana, Sayma. “A Cross National Benchmark for Responsible AI in Language Education: Validity, Equity, Privacy, and Pedagogical Value.” 2026, https://www.researchbysayma.com/article/bb0e1e3f-1a86-417f-b8e1-3e84642b1eac.
Sayma Sultana. “A Cross National Benchmark for Responsible AI in Language Education: Validity, Equity, Privacy, and Pedagogical Value.” (2026). https://www.researchbysayma.com/article/bb0e1e3f-1a86-417f-b8e1-3e84642b1eac.
Sultana S. A Cross National Benchmark for Responsible AI in Language Education: Validity, Equity, Privacy, and Pedagogical Value. 2026. https://www.researchbysayma.com/article/bb0e1e3f-1a86-417f-b8e1-3e84642b1eac
@misc{article_bb0e1e3f1a86417fb8e13e84642b1eac,
  title = {A Cross National Benchmark for Responsible AI in Language Education: Validity, Equity, Privacy, and Pedagogical Value},
  author = {Sayma Sultana},
  year = {2026},
  url = {https://www.researchbysayma.com/article/bb0e1e3f-1a86-417f-b8e1-3e84642b1eac},
}
TY - GEN AU - Sayma Sultana TI - A Cross National Benchmark for Responsible AI in Language Education: Validity, Equity, Privacy, and Pedagogical Value PY - 2026 UR - https://www.researchbysayma.com/article/bb0e1e3f-1a86-417f-b8e1-3e84642b1eac ER -